Boundary
This module handles mesh boundary extraction from coastlines or user provided shapefiles. It underpins the mesh module.
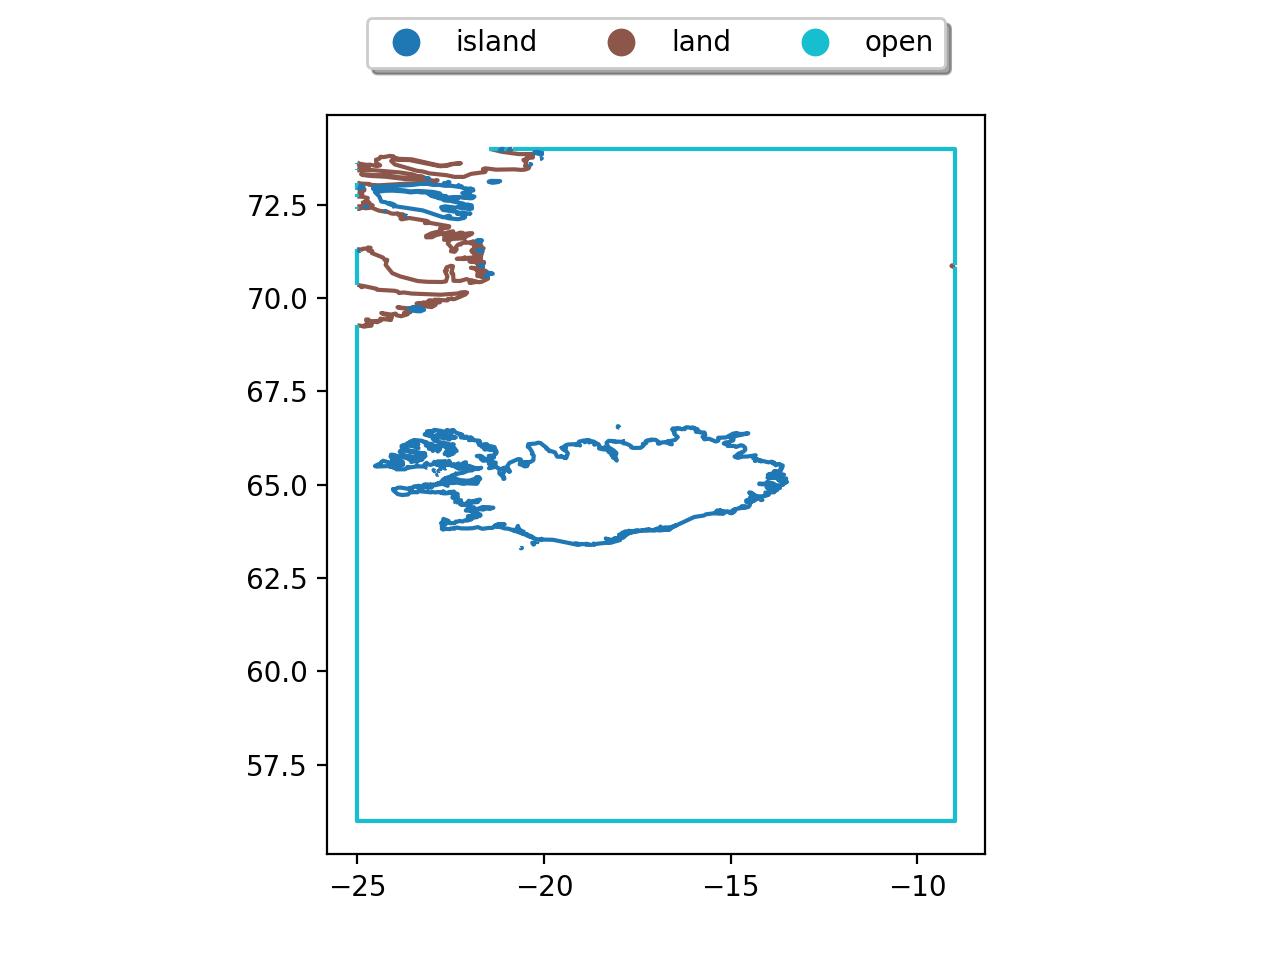
Providing coastlines and a geometry definition, the module returns a GeoDataFrame with the corresponding boundary elements required for mesh generation and model construction.
Example
- coastlines
import geopandas as gp
# use cartopy to get coastlines
import cartopy.feature as cf

gi = cf.GSHHSFeature(scale="intermediate", levels=[1])
iGSHHS = gp.GeoDataFrame(geometry=[x for x in gi.geometries()])
- geometry
# define in a dictionary the properties of the model..
extend = {
    "lon_min": -25.0,  # lat/lon window
    "lon_max": -9.0,
    "lat_min": 56.0,
    "lat_max": 74.0,
}
Using the module as
import pyposeidon.boundary as pb

a = pb.Boundary(geometry=extend, coastlines = iGSHHS)
the contours with their corresponding attributes are
a.contours
                                            geometry    tag     lindex  nps
0   LINESTRING (-9.00000 70.88532, -9.01008 70.879...   land    1010    6
1   LINESTRING (-20.90062 74.00000, -20.83883 73.9...   land    1009    3
2   LINESTRING (-25.00000 73.62663, -24.94011 73.6...   land    1008    54
3   LINESTRING (-25.00000 73.46989, -24.99506 73.4...   land    1007    4
4   LINESTRING (-25.00000 73.09356, -24.91511 73.0...   land    1006    30
... ... ... ... ...
143 LINESTRING (-18.28925 63.53078, -18.28922 63.5...   island  -124    3
144 LINESTRING (-17.93172 63.54208, -17.99917 63.5...   island  -125    10
145 LINESTRING (-20.18253 63.46414, -20.18253 63.4...   island  -126    3
146 LINESTRING (-20.23919 63.42667, -20.27086 63.4...   island  -127    6
147 LINESTRING (-20.62086 63.30167, -20.62089 63.2...   island  -128    3
148 rows × 4 columns
and they can be visualized as
Buffering
Sometimes it is preferable to buffer the coastlines in order to mask high resolution features and smooth out the boundaries.
Setting
b = pb.Boundary(geometry=window, coastlines=iGSHHS, cbuffer = .01)
Note
The units of cbuffer are those of the coastlines.
it can be seen that the boundaries are simplified accordingly
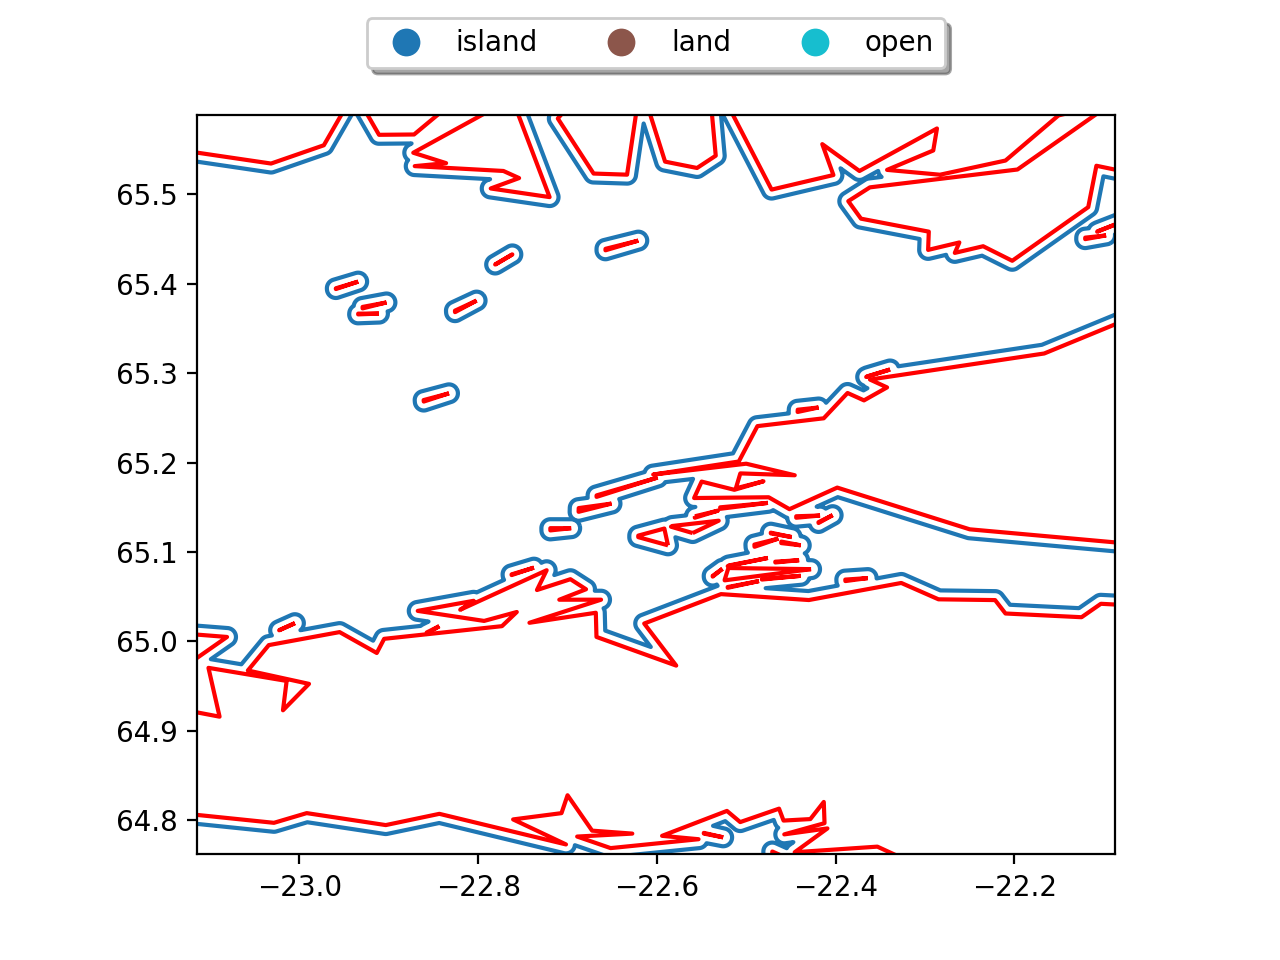
where the new boundary is in blue and the old in red.