Utilities
A number of utilities is included within pyposeidon providing useful functionality.
pplot
Datasets that represent unstructured models, namely those with schism can be visualised using matplotlib as follows.
Assuming g is an output Dataset (see model) the available functions are:
#mesh depiction using `plt.triplot`.
g.pplot.mesh()
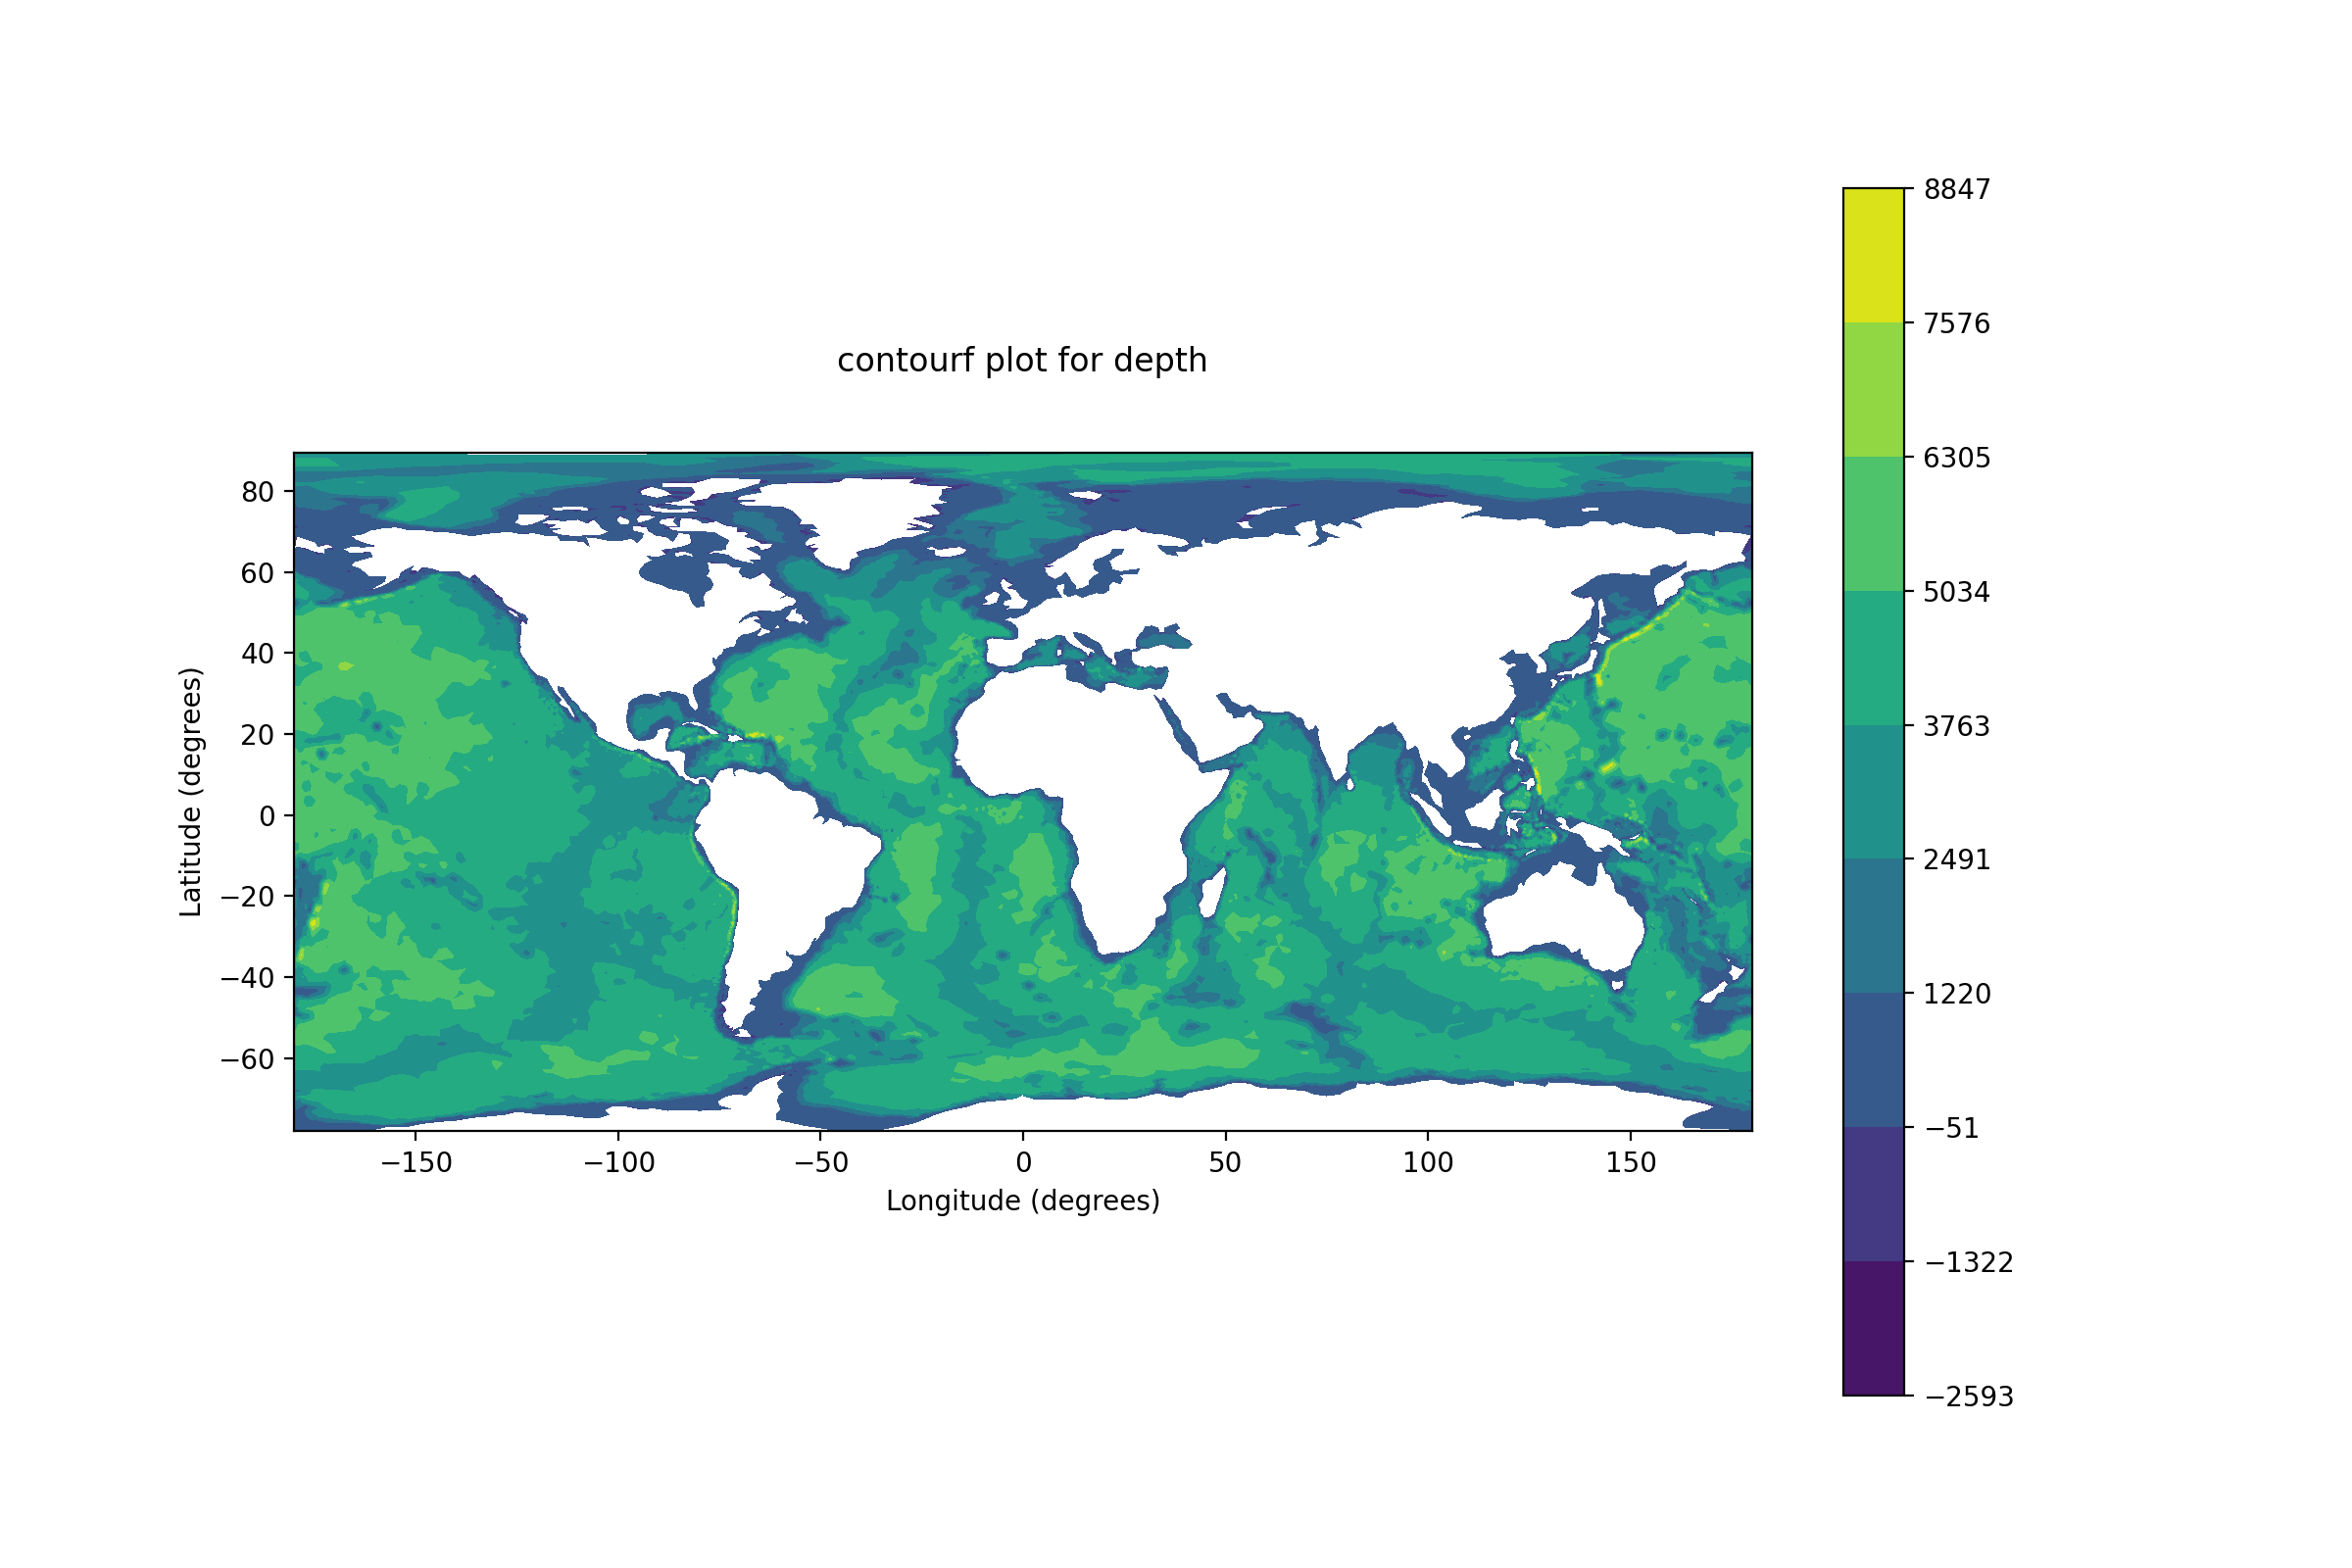
# variable map using `plt.tricontourf`.
g.pplot.contourf(var='depth')
# variable map using `plt.tricontour`.
g.pplot.contour(var='depth')
#vectors using `plt.quiver`.
g.pplot.quiver(it = 2, u=out.hvel.values[2,:,0,0],v=out.hvel.values[2,:,0,1],
scale=.05, title='hvel', color='k')
# animate with `matplotlib.animation`.
g.pplot.frames(var='elev',title='SSH')
g.pplot.qframes(u=g.hvel.values[:,:,0,0],v=g.hvel.values[:,:,0,1],
title='Vel',scale=.05, color='k')
hplot
Similar functionality is available using hvplot.
g.hplot.mesh() #mesh depiction using `gv.TriMesh`.

g.hplot.contourf(var='depth') # variable map using `gv.TriMesh`.

g.pplot.frames(var='elev',title='SSH') # animate with `hv.DynamicMap`.
mplot
Yet another backend for visualising using VTK. Currently mayavi is used for producing the graphs. This provides also 3D plotting capabilities.
g.mplot.mesh(dim='3D') #mesh depiction using `mlab.triangular_mesh`.

g.mplot.contourf(var='depth') # variable map using `mlab.triangular_mesh`.
seam.
When working with a global mesh, the 2D representation of the data is problematic.
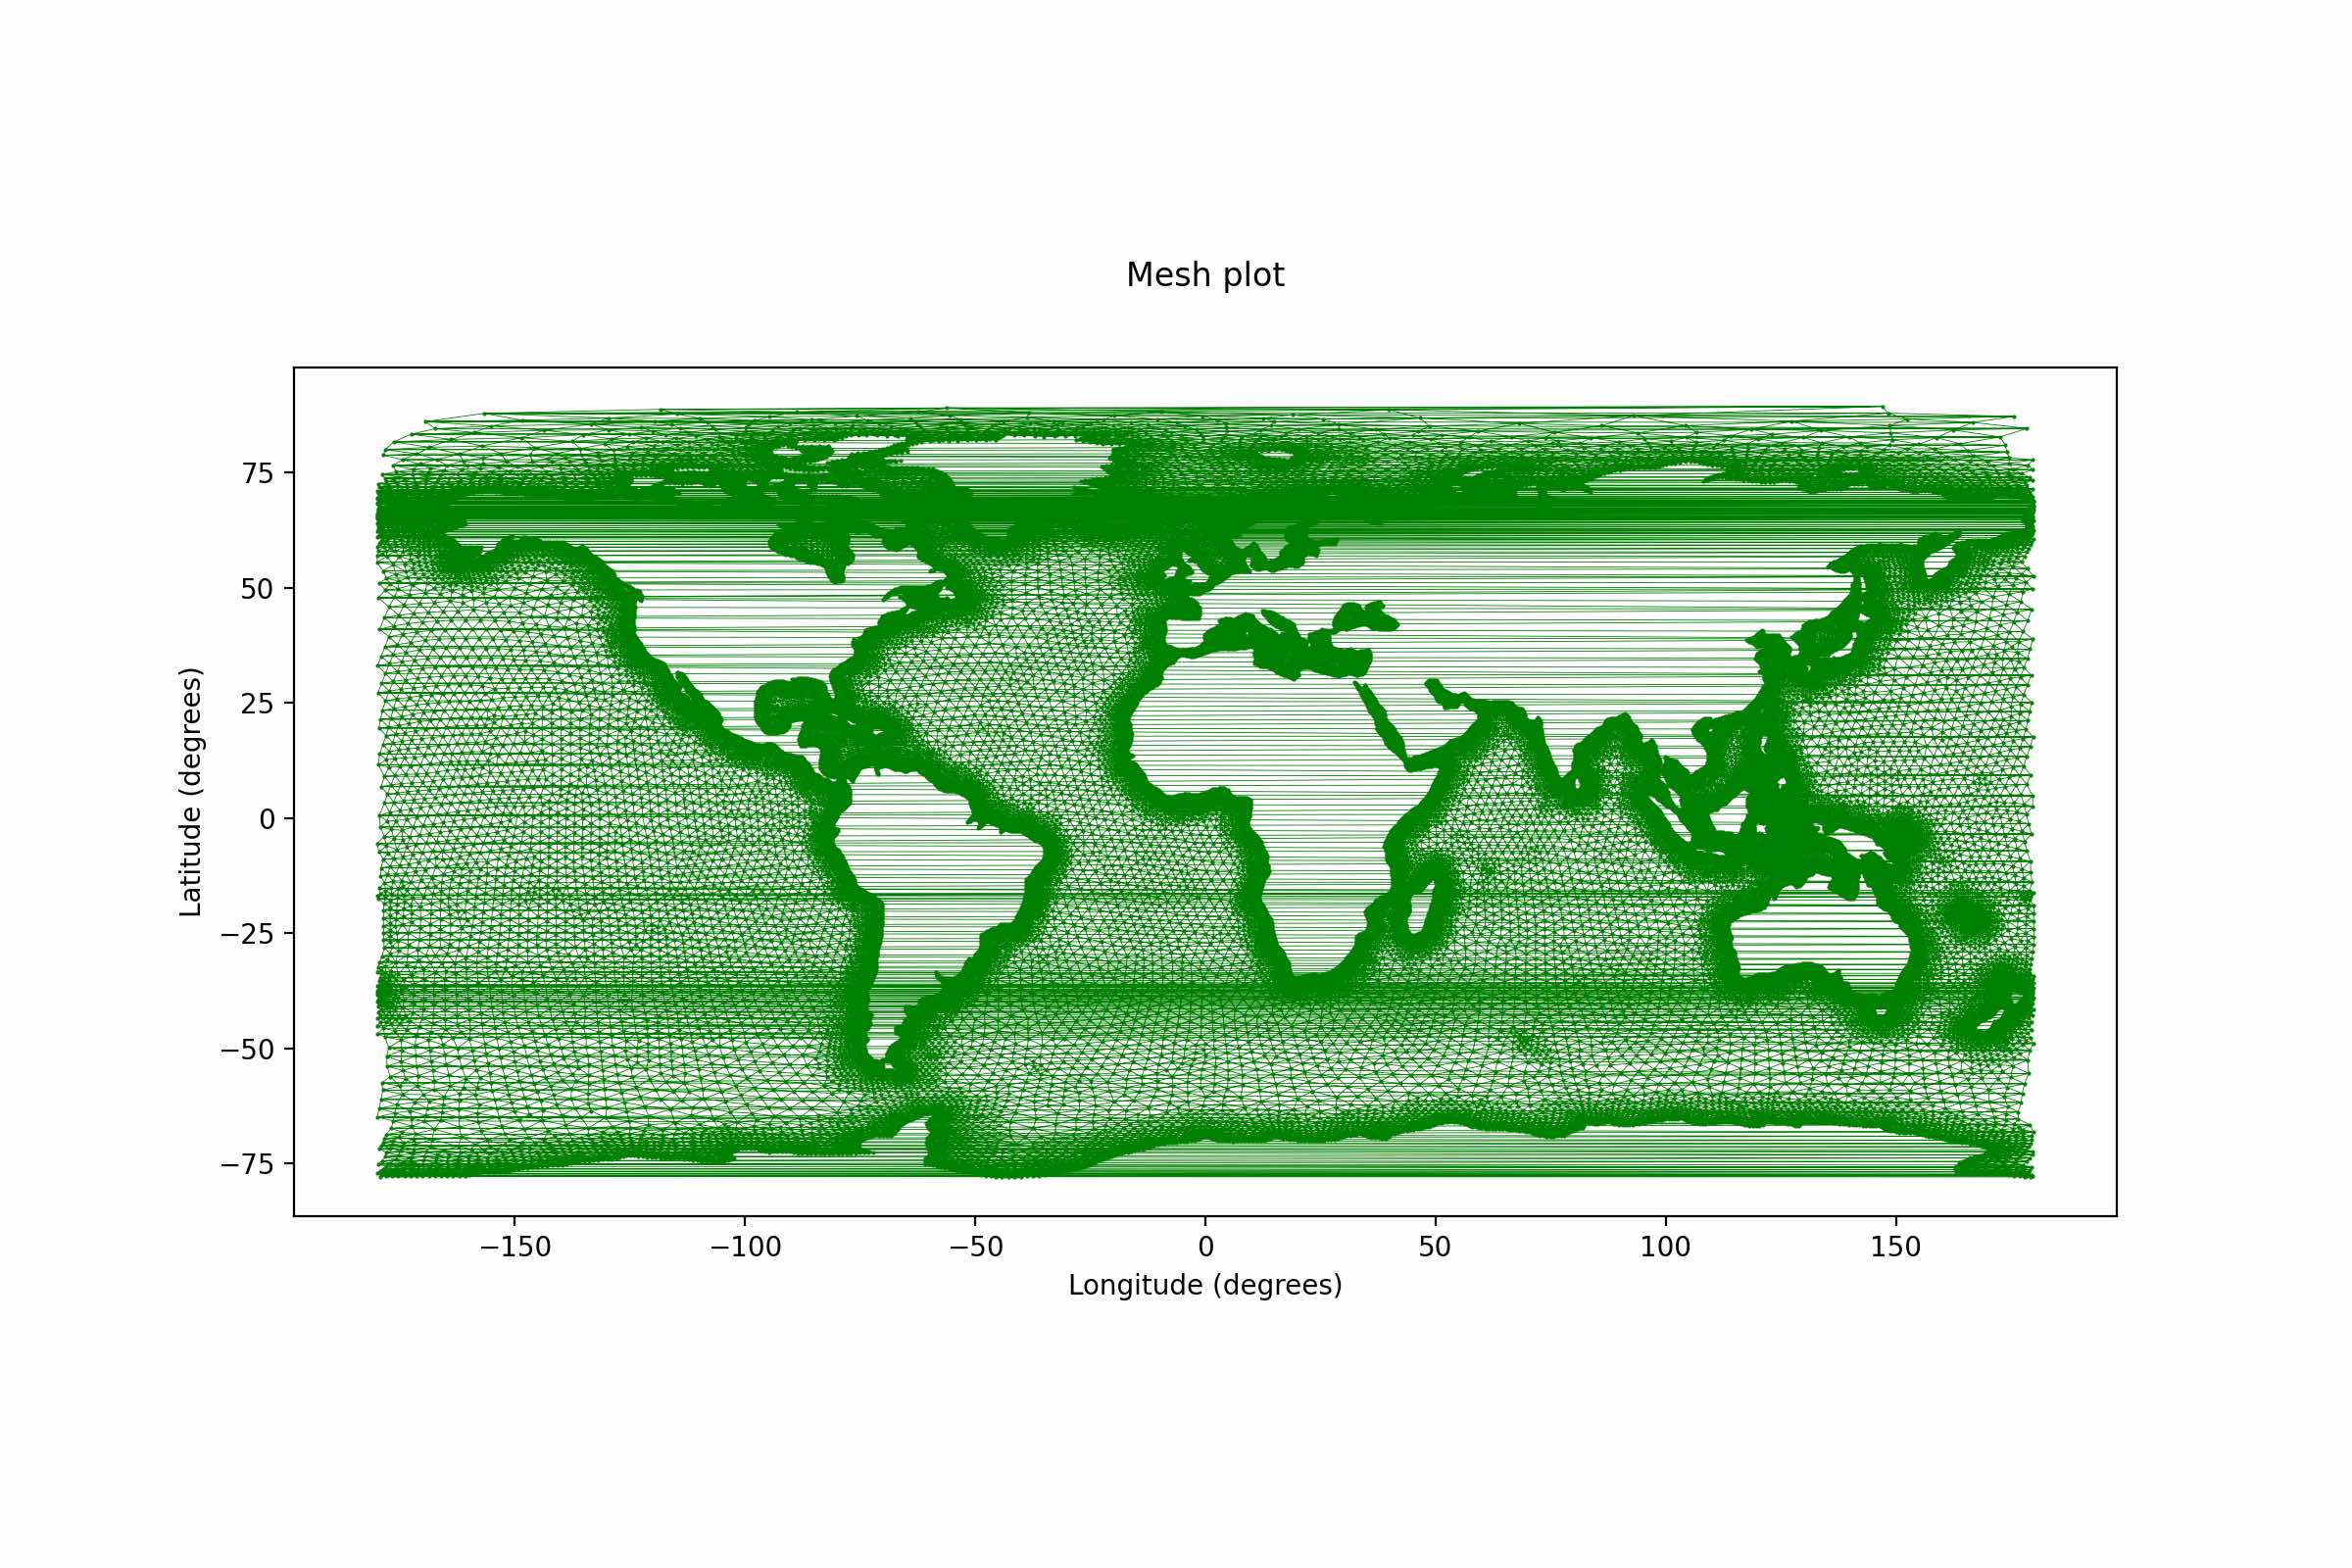
So this mesh
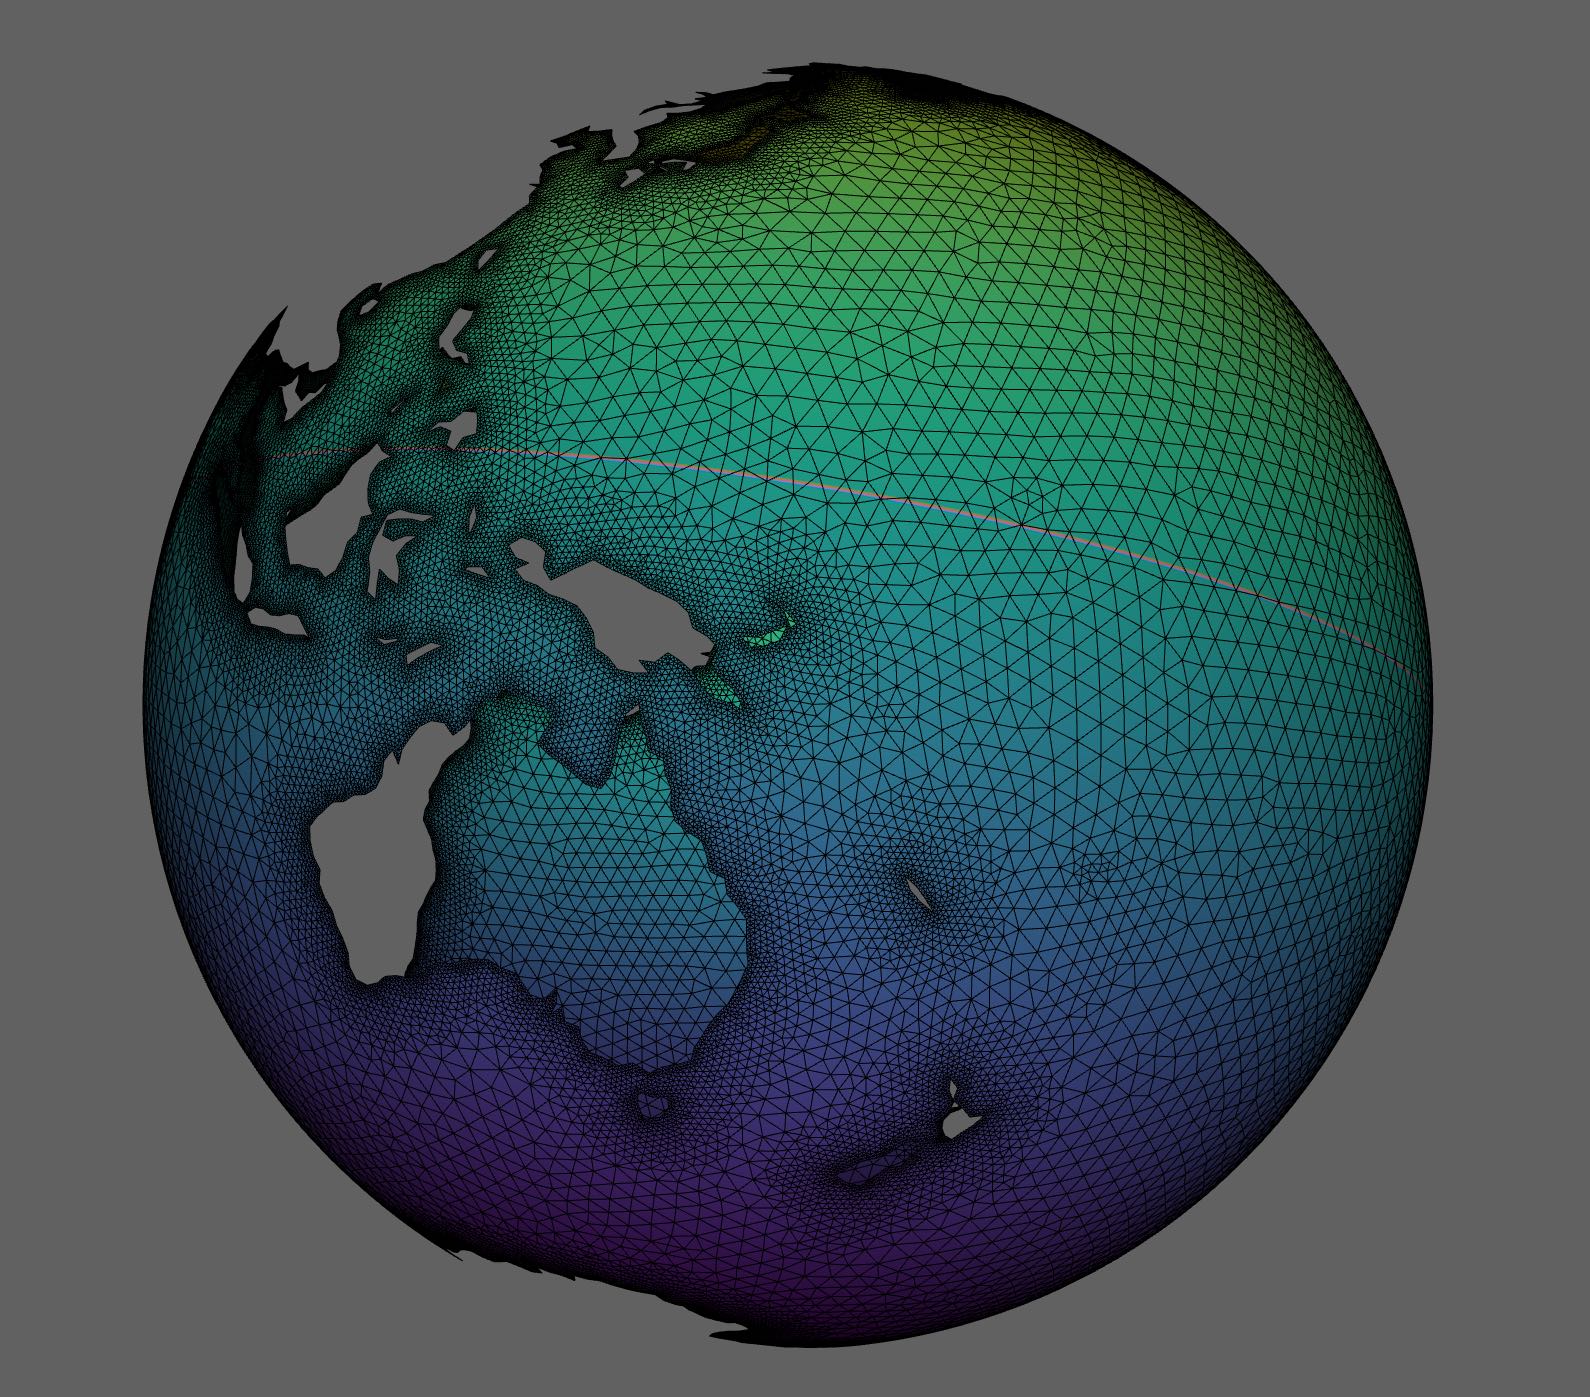
in 2D will have artefacts due to cross over elements...
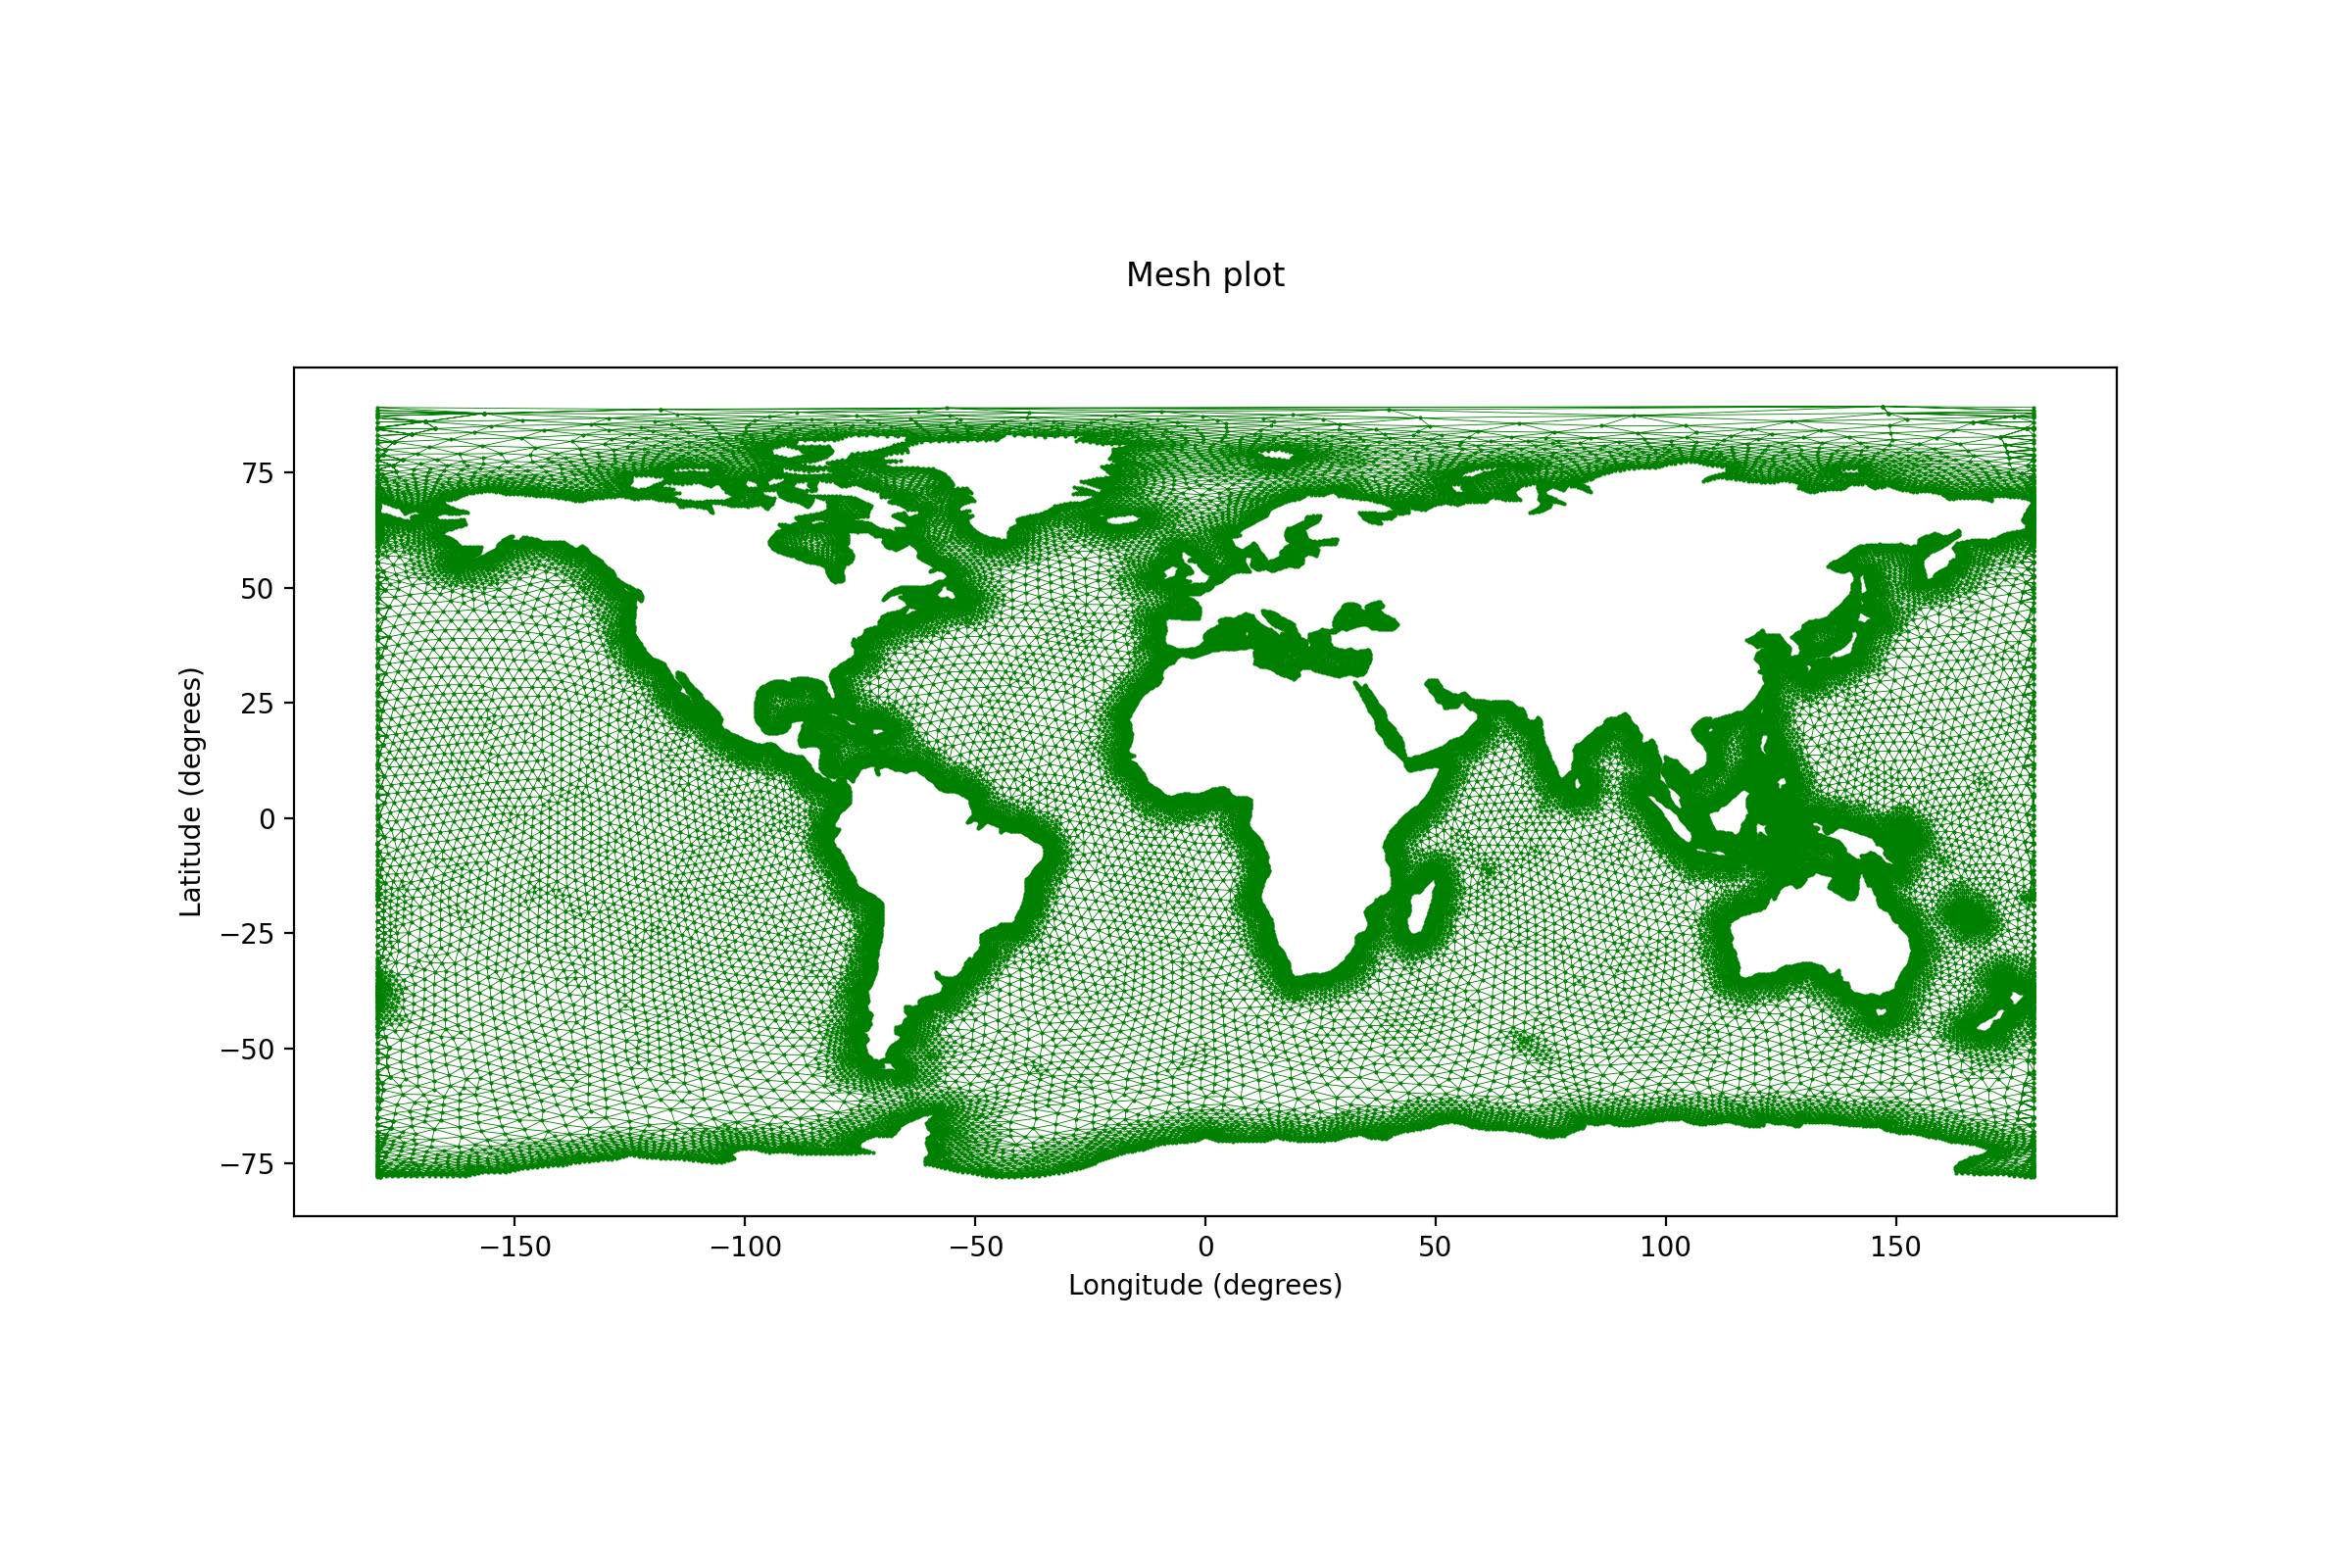
However, using the corresponding utility from pyposeidon, a seam can be created on the international time line, mitigating the problem.
from pyposeidon.utils.seam import get_seam

xn,yn,tri3n= get_seam(x,y,None,tri3) # get new arrays
where x,y,tri3 are the original node coordinates and tessellation.
These new arrays can be used to plot the mesh in 2D without problems,
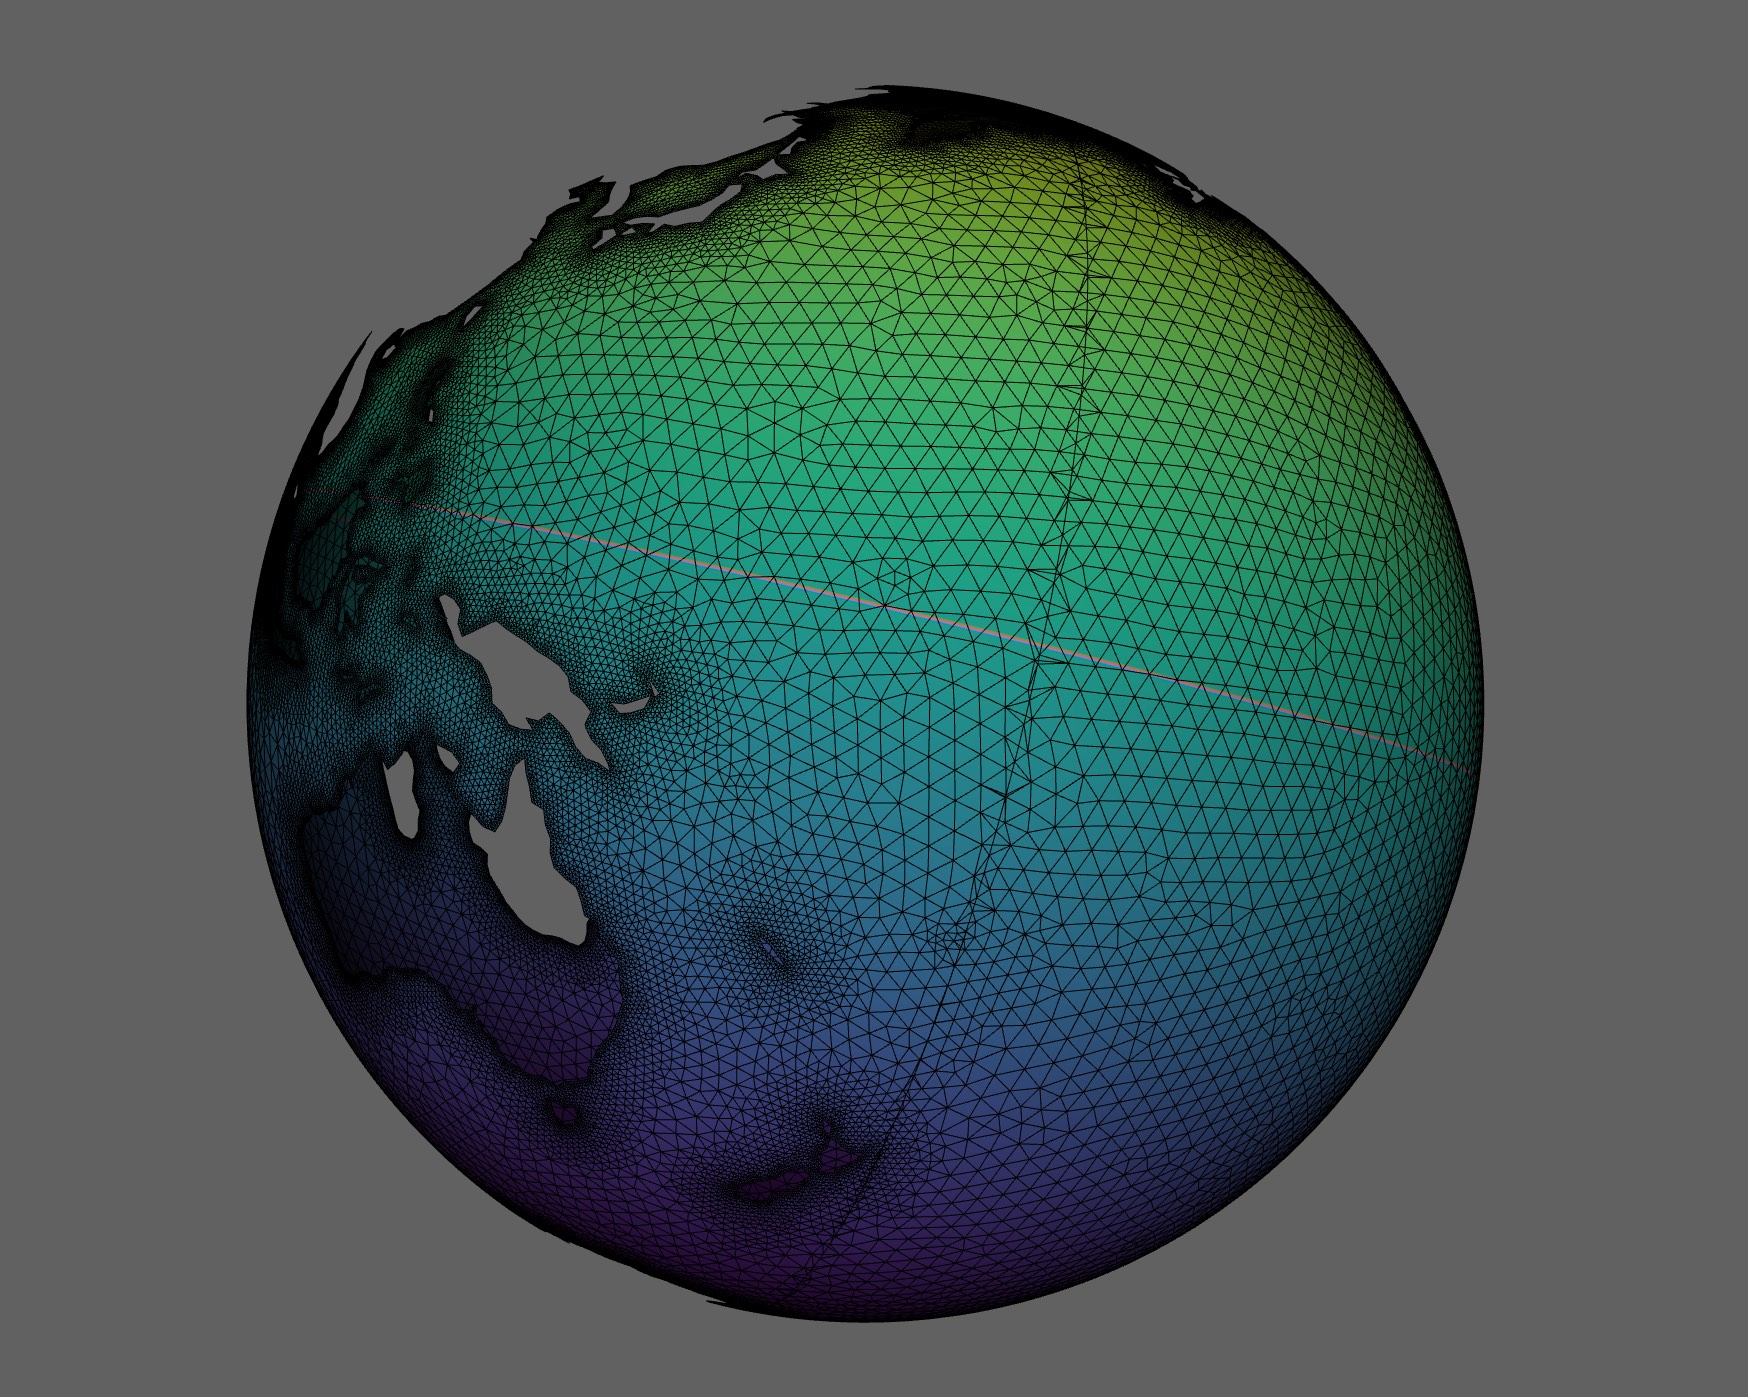
The creation of the seam can be seen better in 3D.
Evaluating any variable in the new adjusted topology becomes:
from pyposeidon.utils.seam import to_2d

bathymetry = to_2d(Dataset,var='depth', mesh=[xn,yn,tri3n])
cast
Any long-time simulation can be performed in several steps. This is true for long hindcasts as well as forecasts. The cast utility can then be used as:
from pyposeidon.utils import cast

# folder for the new run hotstarting from the original folder
new_path = '/path/to/new/run'
# new meteo file
mf = 'path/to/new/meteo/file'

rs = cast.set(solver_name='schism',
        model=b, #reference model, could be instance or json file
        ppath=b.rpath, #original path
        cpath=new_path, #new path
        meteo=mf, #new meteo
        sdate=b.date + pd.DateOffset(hours=12) #new start time
)

rs.run(execute=True)